
Sold by: Grafana Labs
Deployed on AWS
Upgrade open-source Grafana with premium data sources, access control, reporting and other functionality, as well as support and professional services from Grafana Labs, the creators of Grafana. This Grafana Enterprise offering is for customers who want to self-manage Grafana on AWS.
4.5
Overview
Grafana Enterprise is a commercial edition of Grafana that includes premium features not found in the open source version. Grafana Enterprise enables organizations to complete their observability picture, reaching across logs, metrics, traces, and other applications with access to enterprise data sources like AppDynamics and Splunk, enhanced LDAP, SAML, access control, reporting, usage insights, and much more.
Please note: this listing is for customers who would like to self-manage Grafana Enterprise on AWS. It does not apply to Amazon Managed Grafana or Grafana Cloud.
For more information on Grafana Enterprise, see https://grafana.com/products/enterprise/grafana/ .
To learn more or to discuss volume pricing, please reach out to us at amazongrafana@grafana.com .
Highlights
- Visualize and alert on observability and operational data from enterprise data sources including AppDynamics, Splunk, New Relic, Datadog, SignalFx, Oracle, ServiceNow, Jira, Gitlab, Dynatrace, Snowflake, MongoDB, Wavefront, and more
- Increase adoption and keep Grafana secure with enhanced LDAP, SAML, access control, reporting, security, usage insights, and more
- Access Prometheus, Graphite, and Grafana experts as well as hands-on Grafana Labs support teams
Details
Sold by
Categories
Delivery method
Supported services
Delivery option
Helm Chart
Latest version
Operating system
Linux
Deployed on AWS
New
Introducing multi-product solutions
You can now purchase comprehensive solutions tailored to use cases and industries.

Features and programs
Trust Center

Access real-time vendor security and compliance information through their Trust Center powered by Drata or Vanta. Review certifications and security standards before purchase.
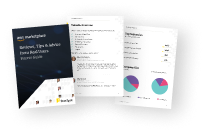
Buyer guide
Gain valuable insights from real users who purchased this product, powered by PeerSpot.
Financing for AWS Marketplace purchases
AWS Marketplace now accepts line of credit payments through the PNC Vendor Finance program. This program is available to select AWS customers in the US, excluding NV, NC, ND, TN, & VT.

Pricing
Pricing is based on the duration and terms of your contract with the vendor. This entitles you to a specified quantity of use for the contract duration. If you choose not to renew or replace your contract before it ends, access to these entitlements will expire.
Additional AWS infrastructure costs may apply. Use the AWS Pricing Calculator to estimate your infrastructure costs.
Dimension | Description | Cost/12 months |
|---|---|---|
Base/Support + 60 Users | Includes a license, support, and up to 60 active users | $40,000.00 |
Additional Active Users | Incremental cost per additional active user | $300.00 |
Dimensions summary
This listing uses a contract model built around two dimensions. The base dimension bundles your license, support, and access for up to 60 active users. It sets your starting price. The second dimension charges per additional active user beyond that base allowance. You add units incrementally as your team grows. Pricing scales with the number of active users you support. An active user is anyone who logs into Grafana during the billing period. The two dimensions work together: the base covers your first 60 users, and the add-on extends coverage one user at a time.
Top-of-mind questions for buyers
An active user is anyone who logs into Grafana during the billing month. If a person does not log in that month, they do not count toward your active user total. Counting resets each billing period, so your charges track real monthly logins rather than total accounts created.
The base dimension covers your license, support, and up to 60 active users as one fixed charge. Once you pass 60 active users in a month, each extra user adds an incremental per-user charge. Both appear together, with the base setting your floor and additional users scaling cost upward.
The base dimension bundles enterprise security features like SAML and LDAP authentication, role-based access control, and data source permissions. It also includes enterprise data source plugins, collaboration and usage insights, custom branding, expert ticket support, long-term support, and indemnification for your self-managed Grafana deployment.
grafana.com+1
Helpful?
Vendor refund policy
All fees are non-cancellable and non-refundable except as required by law.

Legal
Vendor terms and conditions
Upon subscribing to this product, you must acknowledge and agree to the terms and conditions outlined in the vendor's End User License Agreement (EULA) .
Content disclaimer
Vendors are responsible for their product descriptions and other product content. AWS does not warrant that vendors' product descriptions or other product content are accurate, complete, reliable, current, or error-free.
Delivery details
Helm Chart
Supported services: Learn more
- Amazon EKS
- Amazon ECS
- Amazon ECS Anywhere
- Amazon EKS Anywhere
Container image
Containers are lightweight, portable execution environments that wrap server application software in a filesystem that includes everything it needs to run. Container applications run on supported container runtimes and orchestration services, such as Amazon Elastic Container Service (Amazon ECS) or Amazon Elastic Kubernetes Service (Amazon EKS). Both eliminate the need for you to install and operate your own container orchestration software by managing and scheduling containers on a scalable cluster of virtual machines.
Version release notes
Release notes are available on the website https://grafana.com/docs/grafana/latest/release-notes/release-notes-11-6-0/
Additional details
Usage instructions
You can apply your Grafana Enterprise license to a new or existing Grafana Enterprise deployment by updating a configuration setting or environment variable. Your Grafana instance must be deployed on AWS, or have network access to AWS. For more information, see https://grafana.com/docs/grafana/latest/enterprise/license/
Resources
Vendor resources
Support
Vendor support
Grafana Enterprise support includes a critical response SLA, unlimited support over private Slack channel, email and phone, and training, workshops, and professional services from experts at Grafana Labs.
Contact amazongrafana@grafana.com to inquire about Grafana Enterprise.
AWS infrastructure support
AWS Support is a one-on-one, fast-response support channel that is staffed 24x7x365 with experienced and technical support engineers. The service helps customers of all sizes and technical abilities to successfully utilize the products and features provided by Amazon Web Services.
Updated weekly
By Grafana Labs
By IBM Software
Top
10
In Analytics, Log Analysis, Monitoring
Top
25
In Observability, Monitoring and Observability
Top
10
In Generative AI, Log Analysis
Sentiment is AI generated from actual customer reviews on AWS and G2
Functionality
Ease of use
Customer service
Cost effectiveness
Positive reviews
Mixed reviews
Negative reviews
AI generated from product descriptions
Enterprise Data Source Integration
Support for enterprise data sources including AppDynamics, Splunk, New Relic, Datadog, SignalFx, Oracle, ServiceNow, Jira, Gitlab, Dynatrace, Snowflake, MongoDB, and Wavefront
Authentication and Access Control
Enhanced LDAP and SAML authentication with granular access control capabilities
Observability Data Aggregation
Unified visualization and alerting across logs, metrics, traces, and multiple application data sources
Reporting and Usage Analytics
Built-in reporting functionality and usage insights for monitoring adoption and system utilization
Self-Managed Deployment
Self-managed installation and operation of Grafana Enterprise on AWS infrastructure
Request Tracing and Visibility
Captures 100% of all requests in real-time with 1-second granularity for complete application performance visibility without sampling
Automated Root Cause Analysis
Built-in automation and AI-driven root cause analysis with recommendations for faster issue resolution and problem identification
Full-Stack Observability
Provides full-stack visibility across application code, Kubernetes containers (EKS/ECS), and microservices with comprehensive dependency mapping
Multi-Technology Integration
Supports over 300 technology integrations including AWS services, cloud platforms, microservices, and containerized environments
Intelligent Alerting System
SmartAlerts feature delivers tailored alerts with automated discovery of application components and request tracing across distributed systems
AI-Powered Root Cause Analysis
Automatically investigates alerts and pinpoints root causes with 5x faster analysis capabilities.
Natural Language Query Interface
Enables querying of observability data using conversational natural language to identify issues and receive actionable insights.
Real-Time Anomaly Detection
Detects system anomalies in real-time to prevent incidents before they impact users.
OpenTelemetry Integration
Supports standardized OpenTelemetry integration for unified data collection across logs, metrics, and traces in cloud-native environments including Kubernetes, serverless, and microservices.
Multi-Tiered Storage Architecture
Implements multi-tiered storage and data management capabilities to optimize telemetry data retention and reduce storage costs.
Standard contract
No
No
No
Customer reviews
German F.
Proactive, AI-Driven Cloud Monitoring with Grafana Labs
Reviewed on Sep 22, 2026
Review provided by G2
What do you like best about the product?
Grafana Labs enables me to proactively monitor my infrastructure through a cloud-based, AI-driven environment. I appreciate how it has evolved from a visibility system focused on tracking IT KPIs into a more AI-managed environment that supports ongoing monitoring and oversight.
What do you dislike about the product?
The most difficult part is establishing the necessary connections to monitor my local servers; it also requires creating very clear security policies to determine which traffic is permitted.
What problems is the product solving and how is that benefiting you?
It makes things easier for me to have a cloud-based Grafana environment, whereas I previously used it locally alongside another monitoring tool.
Computer Software
Powerful Custom Dashboards for Real-Time Metrics and Infrastructure Monitoring
Reviewed on Sep 21, 2026
Review provided by G2
What do you like best about the product?
Helps me in making of custom dashboards, helps us make centralized views of our infrastructure we use it to integrate with our product to show real time metrics, also internally we make dashboards to monitor the latency and detect and troubleshoot issues, lately the ai features also giving good boilerplate
What do you dislike about the product?
There are a lot of configuration options, and the learning curve was steep. It needs to be easier to learn and get started with. Troubleshooting can also be difficult, especially when trying to figure out whether the issue is with the tool or with our source query itself.
What problems is the product solving and how is that benefiting you?
It helps us monitor our infrastructure without needing to log in or SSH across different systems. We also use it to build real-time dashboards that help both our team and our customers visualize the metrics and properties we’re collecting, instead of having to check multiple systems.
Koli P.
My review about Grafana labs.
Reviewed on Sep 10, 2026
Review provided by G2
What do you like best about the product?
I like its clean UI, with dashboards, metrics, and logs. It makes it easy for me to track my work data and performance.
What do you dislike about the product?
I don’t like its pricing; they could make it more affordable for the features they’re offering.
What problems is the product solving and how is that benefiting you?
It helps me check my dashboards, metrics, and log files all in one place, instead of having to use multiple software tools.
Jaydeepkumar R.
Real-time visibility that makes root cause analysis so much faster
Reviewed on Sep 10, 2026
Review provided by G2
What do you like best about the product?
What really stands out to me is the level of visibility it provides into what’s actually happening behind the scenes during testing cycles. When I’m running automated test suites, being able to correlate test failures with real-time system metrics makes root-cause analysis much faster. I no longer have to dig through separate logs and monitoring tools—everything I need is visible in one dashboard. The alerting setup has also been a game-changer, helping me catch environment issues early before they derail an entire test run.
What do you dislike about the product?
Getting dashboards set up the way I actually want has taken more time than I expected, especially if you’re not already familiar with querying the underlying data sources. There’s definitely a learning curve if you’re coming from a testing background rather than a DevOps one, and it can take a while to get comfortable with how everything fits together.
What problems is the product solving and how is that benefiting you?
In the past, when a test failed intermittently, it took a lot of manual digging to figure out whether it was a real bug, a flaky test, or an environment issue. Now I can pull up system performance data right alongside the test execution results and spot patterns much faster—for example, noticing that a spike in failures lines up with a memory leak or a slow database query. It’s cut down on a lot of back-and-forth with the dev team, since I can actually show the data instead of just saying, “it failed again.” Overall, it’s made root cause analysis during regression cycles feel far less like guesswork.
Vikash K.
Great Visibility with Powerful Dashboards
Reviewed on Sep 10, 2026
Review provided by G2
What do you like best about the product?
As a backend engineer building an AI-driven insurance claims platform, I really value Grafana Labs' ability to aggregate metrics from our diverse tech stack. The custom dashboards we build are essential for tracking response times and visualising our system's performance. Being able to see container health, message queue depth, and model influence time all on one screen helps us identify bottlenecks in our microservices. Hooking Prometheus up to Grafana gave us clear panels to track latency percentiles and container RAM usage across the board. Grafana provides a unified telemetry layer that significantly reduces our mean time to detection, and the vendor-agnostic plugin ecosystem is a huge advantage for seamlessly connecting our software stack.
What do you dislike about the product?
The learning curve for LogQL is undeniably steep. It required a bit of learning to get the syntax right, so it wasn't just plug-and-play. There were some challenges, especially when it came to setting things up for the first time. But once I got a handle on it, things got better.
What problems is the product solving and how is that benefiting you?
In our claim categorisation system, Grafana Labs solves the issue of diving into isolated logs by providing a unified telemetry layer that drastically reduces our mean time to detection. It helps us pinpoint bottlenecks and track microservice performance, improving issue resolution before impacting our users.