AWS Cloud Operations Blog
Accelerate troubleshooting with AWS Observability as a Kiro power
Troubleshooting a distributed application means correlating signals across alarms, traces, logs, and deployments, usually across several consoles while the clock is running. Imagine your on-call engineer gets paged at 2 AM. P99 latency on the checkout API has spiked past the SLO threshold. What follows is a familiar scramble: open Application Signals to check service health and SLO compliance, switch to distributed traces to find slow operations, pivot to Amazon CloudWatch Log Insights to search for errors and correlate recent deployment events. Thirty minutes of frantic context switching later, you’ve correlated enough signals to form a hypothesis.
Modern distributed applications generate an overwhelming volume of observability data across metrics, logs, traces, and security events. The tools to investigate are powerful, but the sheer complexity of correlating signals across services, combined with tribal knowledge that lives in team members’ heads rather than in runbooks, makes every incident a time-consuming puzzle that inflates mean time to resolution (MTTR) and degrades customer experience. Teams need a way to reason across all this data where they already work: their IDE.
Kiro is already a powerful AI-assisted troubleshooting tool for developers. AWS Observability as a Kiro power takes it to the next level, packaging the deep operational knowledge our teams have accumulated into five specialized MCP servers (CloudWatch, CloudWatch Application Signals, CloudTrail, Amazon Managed Prometheus, and AWS Documentation) with nine steering files that give Kiro’s AI agent the domain expertise to investigate incidents end-to-end through natural language. Instead of juggling dashboards, you ask questions like “What alarms are firing?” or “Show me traces with high latency” and get correlated, contextual answers without leaving your editor.
In this post, you’ll deploy an AWS Lambda-backed API with simulated latency issues and walk through a hands-on investigation. This walkthrough uses four of the power’s five MCP servers (CloudWatch, CloudWatch Application Signals, CloudTrail, and AWS Documentation); the Amazon Managed Prometheus server is outside the scope of this example. You’ll identify active alarms, analyze distributed traces, correlate recent deployments, and use automated gap analysis to improve your function’s observability, all from within Kiro IDE.
What is the AWS Observability power?
The AWS Observability power packages five specialized MCP servers with targeted observability guidance:
- CloudWatch MCP server – Provides tools for alarm troubleshooting, log analysis, metric investigation, and alarm recommendations.
- CloudWatch Application Signals MCP server – Offers tools for service health monitoring, SLO compliance tracking, distributed tracing, and operation-level performance analysis.
- CloudTrail MCP server – Delivers tools for security investigation, compliance auditing, API activity tracking, and change correlation.
- Amazon Managed Prometheus MCP server – Provides PromQL querying against Amazon Managed Prometheus (AMP) workspaces with SigV4 authentication.
- AWS Documentation MCP server – Enables contextual access to AWS service documentation and best practices.
This unified toolkit gives Kiro agents instant context for comprehensive workflows including alarm response, anomaly detection, distributed tracing, SLO compliance monitoring, and security investigation. Additionally, the power includes automated gap analysis that examines your code to identify missing instrumentation patterns, such as unlogged errors, missing correlation IDs, or absent distributed tracing, and provides actionable recommendations.
The power includes nine comprehensive steering files covering:
- Incident response and troubleshooting.
- Log analysis with CloudWatch Logs Insights.
- Alerting setup and alarm configuration.
- Performance monitoring and distributed tracing.
- Security auditing with CloudTrail.
- Observability gap analysis.
- Prometheus and Amazon Managed Prometheus (AMP) metrics.
- Application Signals setup.
- CloudTrail data source selection.
The AWS Observability power is available now for one-click installation in Kiro IDE and on the Kiro powers webpage. Learn more in the official AWS announcement and explore the open-source repositories on GitHub.
Note: The AWS Observability power is actively maintained and continues to expand. As of publication, it includes five MCP servers and nine steering files; the walkthrough in this post uses four of these servers.
Solution overview
When you ask Kiro a question about your infrastructure, the Observability power routes your query to the appropriate MCP server. Each server authenticates using your local AWS credentials and calls the corresponding AWS APIs – CloudWatch for metrics and logs, CloudWatch Application Signals and X-Ray for distributed traces, CloudTrail for API activity. The results are returned to Kiro’s agent, which correlates data across services and presents a unified analysis.
The nine steering files provide the agent with domain-specific context for common workflows like incident response and alarm investigation, so it knows which signals to check and in what order.
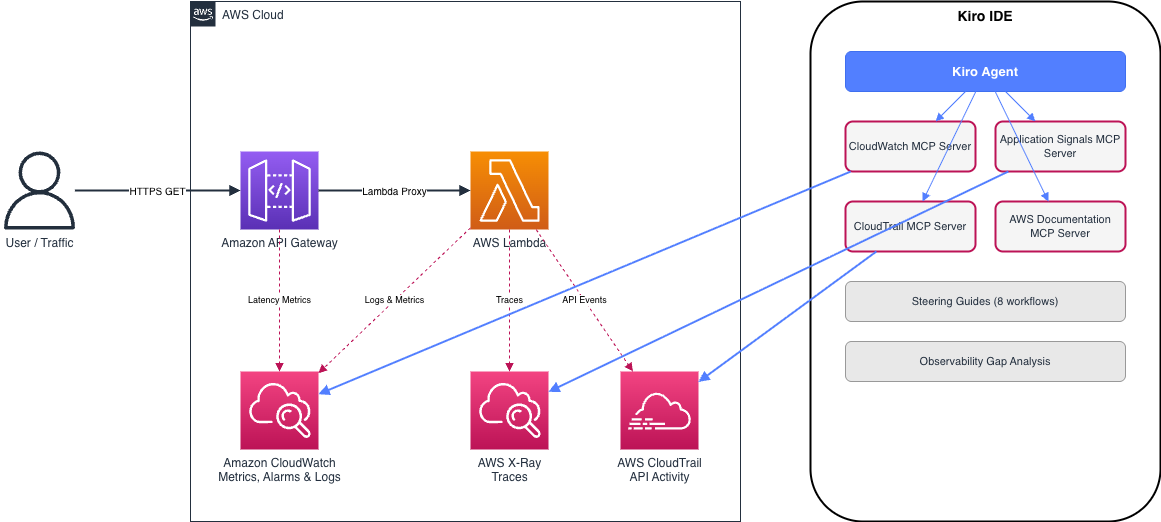
Figure 1 – Solution architecture overview
Prerequisites
To follow along with this walkthrough, you need:
AWS Account Setup:
- An AWS account with AWS Command Line Interface (AWS CLI) configured.
- AWS Identity and Access Management (AWS IAM) permissions for Lambda, API Gateway, CloudWatch, CloudTrail, and X-Ray.
- CloudTrail logging enabled (default in most accounts).
Local Environment:
- Kiro IDE version 1.0.0 or later installed.
Set up the simulated environment
The best way to understand the power of AI-assisted observability is to experience it firsthand. This hands-on exercise sets up a realistic scenario, a Lambda-backed API with intermittent latency spikes, and walks you through investigating it using four of the power’s MCP servers (CloudWatch, CloudWatch Application Signals, CloudTrail, and AWS Documentation) without leaving Kiro.
Note: This walk through creates a publicly accessible API Gateway endpoint with no authentication. Use it only for testing and clean up resources when done.
Setting up the environment
Installing AWS Observability power
- Open Kiro IDE.
- Navigate to the Powers marketplace.
- Search for “AWS Observability”.
- Choose “Install” for one-click installation.
The power automatically loads all five MCP servers and steering files, making them immediately available for natural language queries.
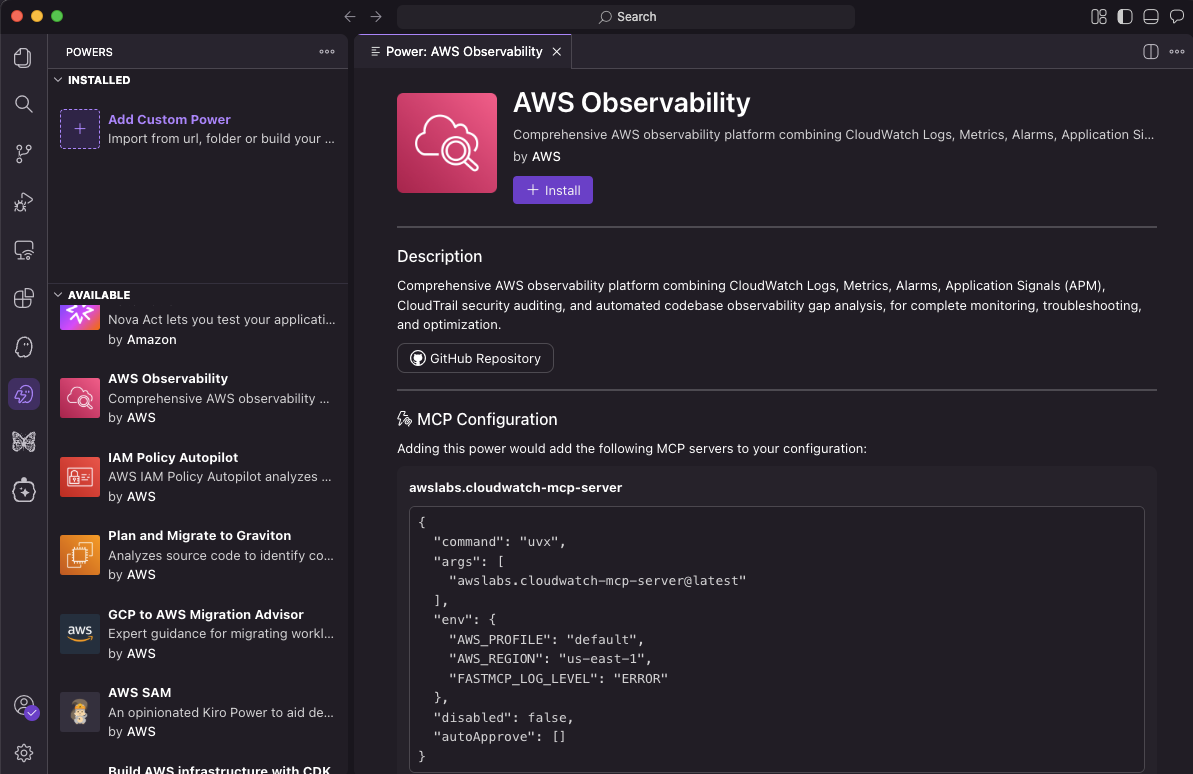
Figure 2 – AWS Observability power installation screen
Set your environment variables
Open a terminal with the AWS CLI configured and set the following variables. Note that following steps assume a Linux compatible environment.
export AWS_REGION=us-east-1
export AWS_ACCOUNT_ID=$(aws sts get-caller-identity --query Account --output text)
Step 1: Create the IAM role
aws iam create-role \
--role-name KiroDemoLambdaRole \
--assume-role-policy-document '{
"Version": "2012-10-17",
"Statement": [{
"Effect": "Allow",
"Principal": {"Service": "lambda.amazonaws.com"},
"Action": "sts:AssumeRole"
}]
}'

aws iam attach-role-policy \
--role-name KiroDemoLambdaRole \
--policy-arn arn:aws:iam::aws:policy/service-role/AWSLambdaBasicExecutionRole

aws iam attach-role-policy \
--role-name KiroDemoLambdaRole \
--policy-arn arn:aws:iam::aws:policy/AWSXRayDaemonWriteAccess
Note: Wait approximately 10 seconds before proceeding to Step 2 to allow IAM role propagation.
Step 2: Create and deploy the Lambda function with simulated latency
This function simulates a real-world scenario: most requests complete in ~100ms, but ~30% hit a slow code path taking 3-4 seconds. Notice the code is intentionally minimal: no logging, no error handling, no request tracking. The kind of code teams ship in a rush.
cat << 'EOF' > lambda_function.py
import json
import time
import random

def lambda_handler(event, context):
# Simulate variable latency - ~30% of requests are slow
delay = random.choice([0.1, 0.1, 0.1, 0.1, 0.1, 0.1, 0.1, 3.0, 3.5, 4.0])
time.sleep(delay)

return {
"statusCode": 200,
"body": json.dumps({"message": "Hello from Lambda!"}),
}
EOF
Package and deploy:
zip function.zip lambda_function.py

aws lambda create-function \
--function-name KiroDemoSlowFunction \
--runtime python3.12 \
--role "arn:aws:iam::${AWS_ACCOUNT_ID}:role/KiroDemoLambdaRole" \
--handler lambda_function.lambda_handler \
--zip-file fileb://function.zip \
--timeout 10 \
--tracing-config Mode=Active
Note: The command enables X-Ray tracing with `–tracing-config Mode=Active`, giving you distributed traces with no additional code changes.
Step 3: Expose the function via API Gateway
Create the REST API and configure the `/hello` endpoint:
API_ID=$(aws apigateway create-rest-api \
--name KiroDemoAPI \
--query 'id' --output text)

ROOT_ID=$(aws apigateway get-resources \
--rest-api-id "$API_ID" \
--query 'items[?path==`/`].id' --output text)

RESOURCE_ID=$(aws apigateway create-resource \
--rest-api-id "$API_ID" \
--parent-id "$ROOT_ID" \
--path-part hello \
--query 'id' --output text)
Add a GET method with Lambda proxy integration:
aws apigateway put-method \
--rest-api-id "$API_ID" \
--resource-id "$RESOURCE_ID" \
--http-method GET \
--authorization-type NONE

aws apigateway put-integration \
--rest-api-id "$API_ID" \
--resource-id "$RESOURCE_ID" \
--http-method GET \
--type AWS_PROXY \
--integration-http-method POST \
--uri "arn:aws:apigateway:${AWS_REGION}:lambda:path/2015-03-31/functions/arn:aws:lambda:${AWS_REGION}:${AWS_ACCOUNT_ID}:function:KiroDemoSlowFunction/invocations"
Grant API Gateway permission to invoke the Lambda function and deploy:
aws lambda add-permission \
--function-name KiroDemoSlowFunction \
--statement-id apigateway-invoke \
--action lambda:InvokeFunction \
--principal apigateway.amazonaws.com \
--source-arn "arn:aws:execute-api:${AWS_REGION}:${AWS_ACCOUNT_ID}:${API_ID}/*/GET/hello"

aws apigateway create-deployment \
--rest-api-id "$API_ID" \
--stage-name prod
Step 4: Create the CloudWatch alarm for P99 latency
aws cloudwatch put-metric-alarm \
--alarm-name API-Gateway-P99-Latency-High \
--alarm-description "High P99 latency on API Gateway" \
--metric-name Latency \
--namespace AWS/ApiGateway \
--extended-statistic p99 \
--period 60 \
--evaluation-periods 2 \
--threshold 2000 \
--comparison-operator GreaterThanThreshold \
--dimensions Name=ApiName,Value=KiroDemoAPI Name=Stage,Value=prod
Step 5: Generate traffic to trigger the alarm
echo "Sending requests to trigger the alarm (runs for ~5 minutes)..."
for i in {1..100}; do
curl -s "https://${API_ID}.execute-api.${AWS_REGION}.amazonaws.com/prod/hello"
echo " - Request $i completed"
sleep 3
done
The alarm requires 2 consecutive 60-second evaluation periods with p99 latency above 2000ms. The loop runs long enough to ensure the alarm triggers. You can check the alarm state while the loop is still running.
Note: Make sure you have a project folder open in Kiro (or open an empty project). The power’s MCP servers only activate after you load a workspace. If Kiro asks for your AWS region, specify us-east-1 (or whichever region you deployed to). The power uses your local AWS credentials and may prompt for region context on the first query.
Investigating with the AWS Observability power
With traffic flowing and the alarm firing, open Kiro IDE and start investigating. Each step below uses a different capability of the Observability power.
Investigation 1: Identify active alarms (CloudWatch MCP Server)
In Kiro, ask:
> “What alarms are currently in ALARM state?”
The CloudWatch MCP server retrieves your active alarms and shows that `API-Gateway-P99-Latency-High` is firing with p99 latency exceeding the 2000ms threshold. Follow up with:
> “What are the recent metric data points for the API-Gateway-P99-Latency-High alarm?”
You’ll see the actual latency values that triggered the alarm, confirming the intermittent slow requests with p99 values around 3500-4000ms.
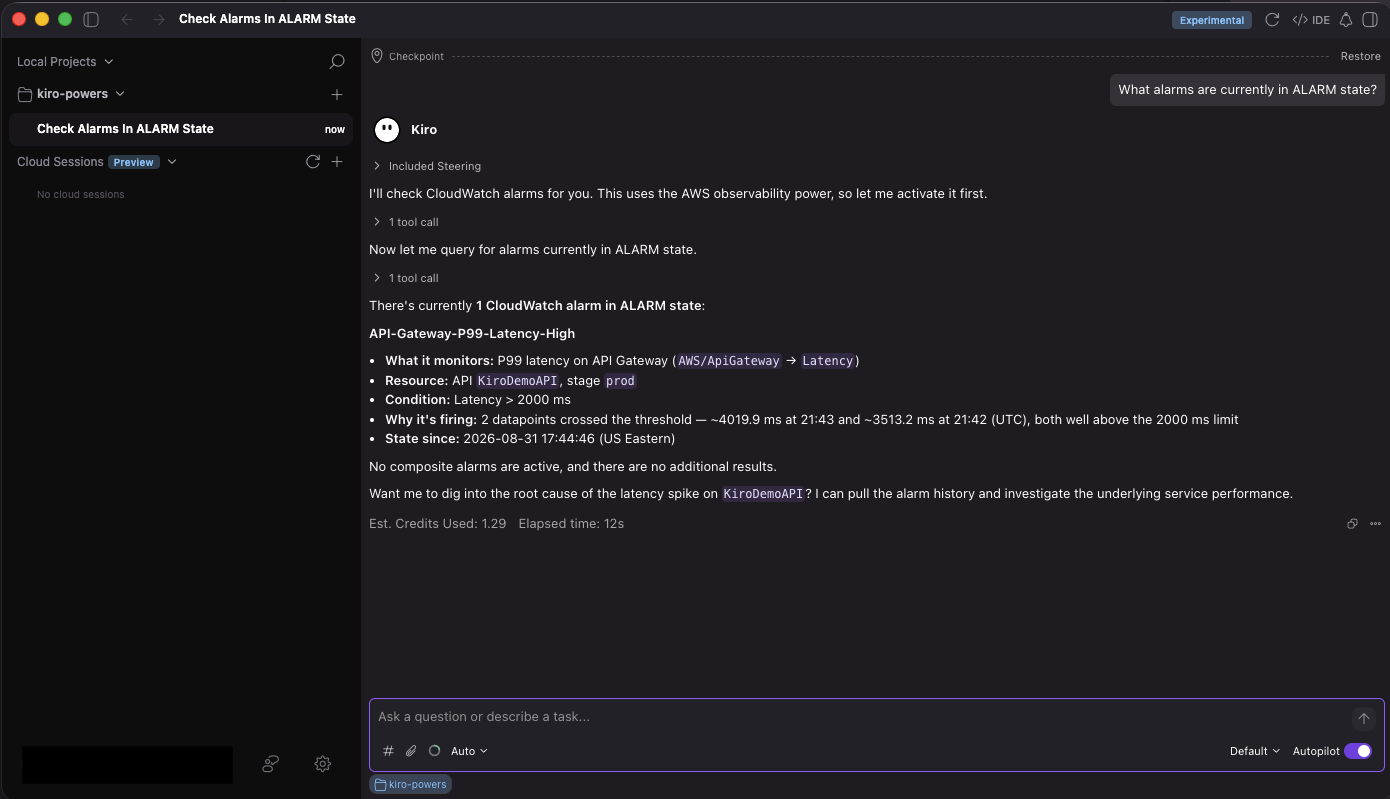
Figure 3 – Alarm investigation output
Investigation 2: Analyze logs (CloudWatch MCP Server)
> “Analyze the logs for KiroDemoSlowFunction in the last 30 minutes”
The power queries CloudWatch Logs, but since the function has no structured logging, the results are limited to basic Lambda platform logs (START, END, REPORT). There are no application-level log entries to help diagnose the latency issue. This is a gap you’ll address in Investigation 5.
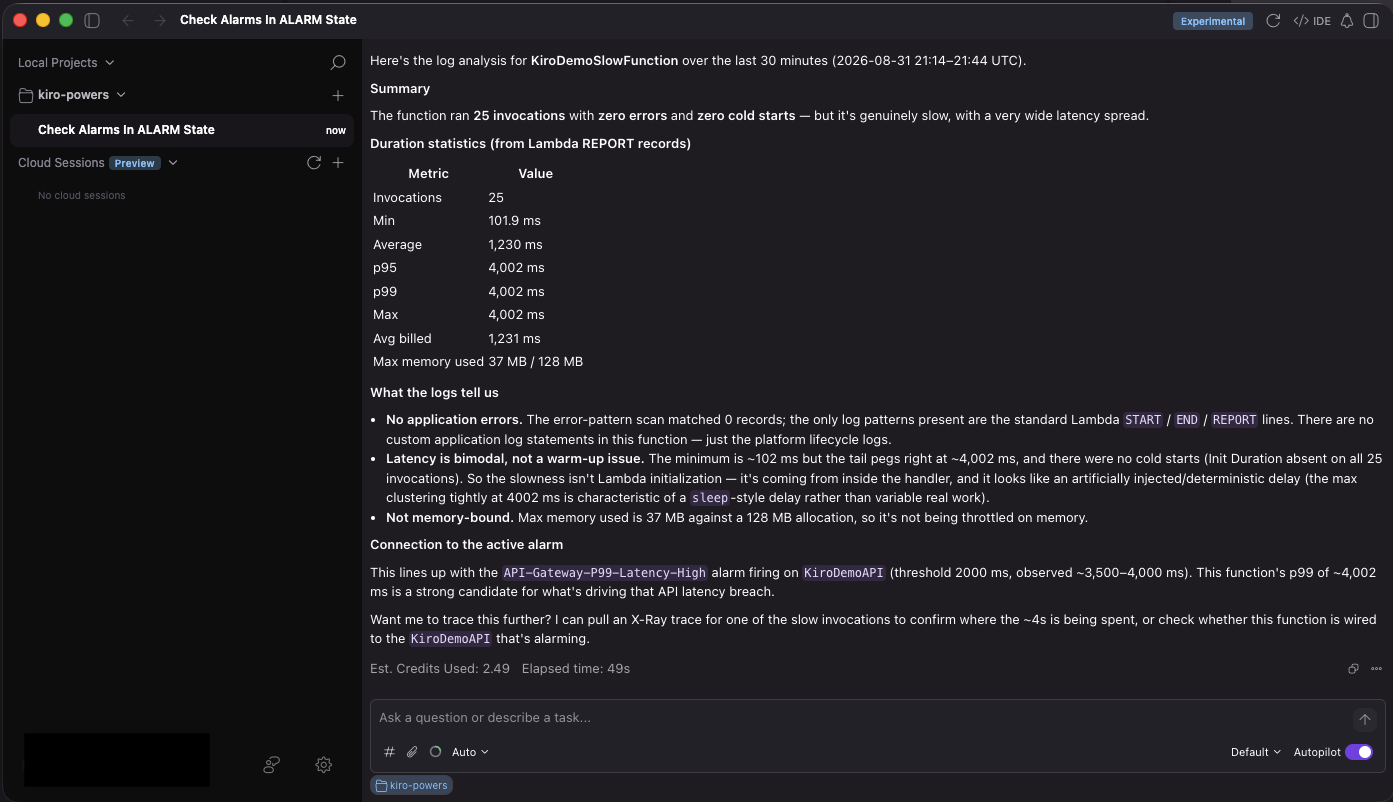
Figure 4 – Log analysis output
Investigation 3: Examine distributed traces (CloudWatch Application Signals MCP Server)
Ask Kiro:
> “Show me traces for KiroDemoSlowFunction with high latency”
The Application Signals MCP server retrieves X-Ray traces for your function and highlights the slow invocations. Application Signals uses X-Ray as its tracing backend, so once you enable active tracing in Step 2, you don’t need additional Application Signals configuration. You can see the exact duration breakdown, confirming the latency is in the function execution, not in API Gateway overhead. Follow up with:
> “What is the latency distribution for this service?”
This shows you the p50, p90, p95, and p99 latency values, making the tail latency problem clearly visible.
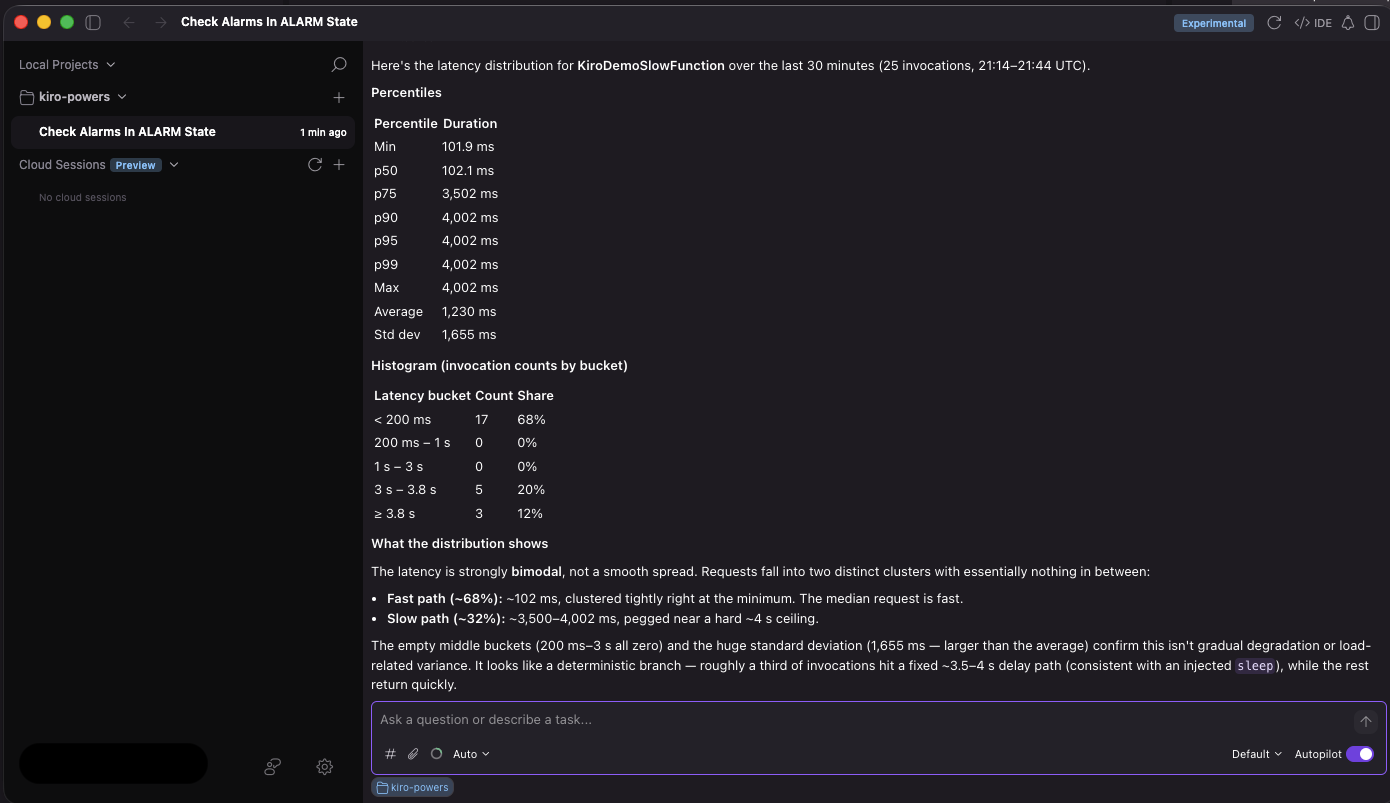
Figure 5 – Trace analysis output
Investigation 4: Correlate with recent changes (CloudTrail MCP Server)
Ask Kiro:
> “What changes were made to KiroDemoSlowFunction in the last 2 hours?”
The CloudTrail MCP server queries API activity and shows the `CreateFunction` and `UpdateFunctionCode` events with timestamps, helping you correlate when the problematic code was deployed. Follow up with:
> “Were there any IAM or configuration changes to this function’s execution role recently?”
This rules out permission changes as a contributing factor, a common step in real incident investigations.
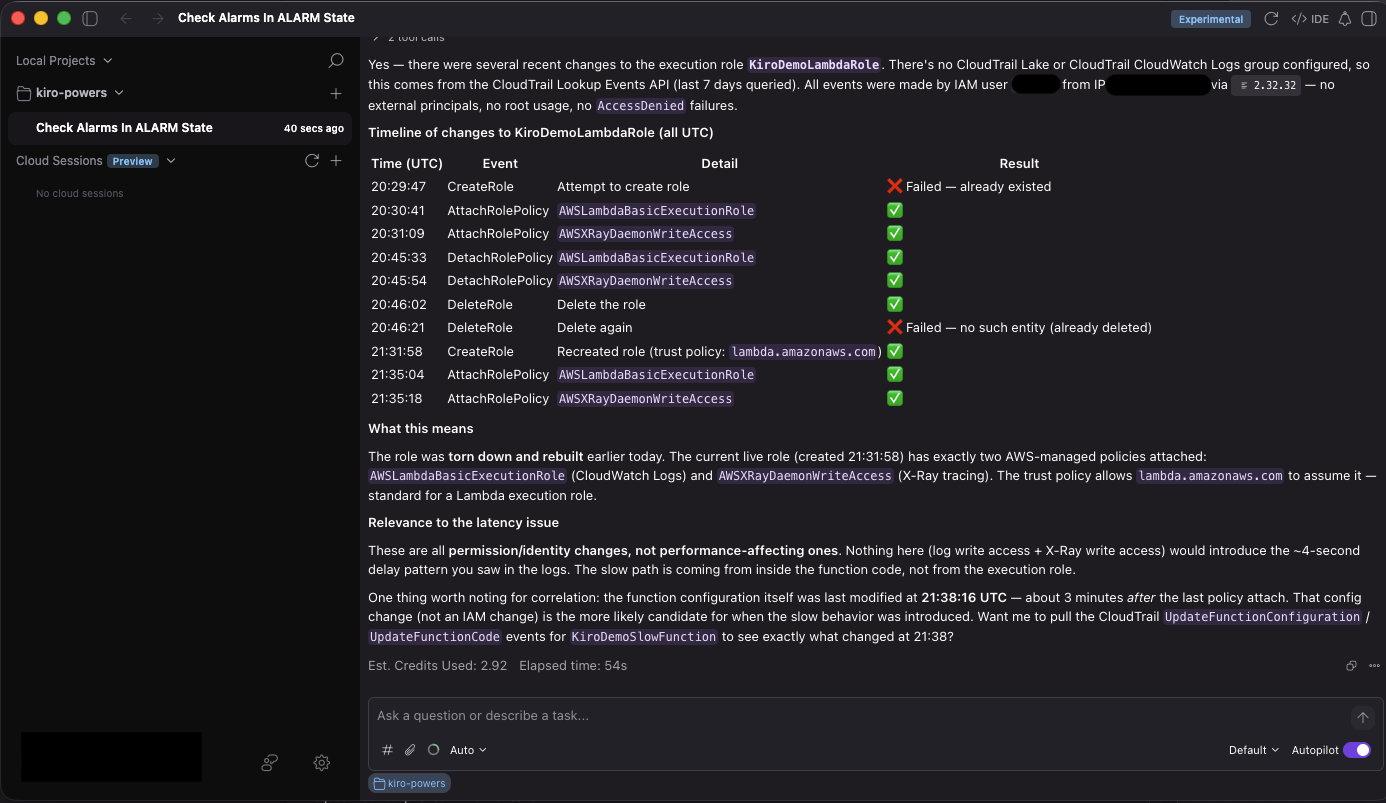
Figure 6 – Change correlation output
Investigation 5: Improve observability and redeploy (gap analysis)
Now that you’ve identified the latency issue but struggled with limited logs, ask Kiro to analyze the code:
> “Analyze my lambda_function.py for observability gaps”
The power examines your code and flags critical gaps:
- No logging: The function produces no application logs, making it impossible to diagnose issues from CloudWatch Logs.
- No error handling: Unhandled exceptions will crash silently with no diagnostic information.
- No request correlation: Without request IDs in logs, you can’t trace individual requests across services.
- No latency tracking: The function doesn’t record how long operations take.
Ask Kiro to fix these gaps:
> “Update lambda_function.py based on the observability recommendations”
Kiro enhances the function with structured JSON logging, request correlation IDs, latency tracking, error handling, and warning-level logs for slow operations. Redeploy the improved function:
zip function.zip lambda_function.py

aws lambda update-function-code \
--function-name KiroDemoSlowFunction \
--zip-file fileb://function.zip
Generate more traffic and re-run Investigation 2. Now you’ll see rich, structured logs with `slow_operation_detected` warnings, request IDs, and duration metrics, the observability data you were missing during the initial investigation.
Cleanup
Remove all resources created during the hands-on exercise. These commands are safe to re-run. The || true suffix ensures a missing resource does not halt the cleanup:
aws apigateway delete-rest-api --rest-api-id "$API_ID" || true
aws lambda delete-function --function-name KiroDemoSlowFunction || true
aws cloudwatch delete-alarms --alarm-names "API-Gateway-P99-Latency-High" || true
aws iam detach-role-policy --role-name KiroDemoLambdaRole \
--policy-arn arn:aws:iam::aws:policy/service-role/AWSLambdaBasicExecutionRole || true
aws iam detach-role-policy --role-name KiroDemoLambdaRole \
--policy-arn arn:aws:iam::aws:policy/AWSXRayDaemonWriteAccess || true
aws iam delete-role --role-name KiroDemoLambdaRole || true
aws logs delete-log-group \
--log-group-name /aws/lambda/KiroDemoSlowFunction || true
# Remove local files
rm -f lambda_function.py function.zip
What you accomplished and what’s next
Without opening a single AWS console tab, you just completed a full incident investigation: identified a firing alarm, traced the latency to a slow code path, correlated the deployment that introduced it, and upgraded the function from zero observability to structured logging with request correlation, all through natural language in your IDE.
Here’s what each MCP server contributed to the workflow:
| MCP Server | What It Answered | Traditional Approach |
|---|---|---|
| CloudWatch | Which alarms are firing and why? | Manually navigating the CloudWatch Alarms console, choosing each alarm to view metric history |
| Application Signals | Where exactly is the latency? | Opening X-Ray, filtering traces, cross-referencing durations across service map nodes |
| CloudTrail | Did a recent change cause this? | Searching CloudTrail event history, filtering by resource name, reading raw JSON events |
| Gap analysis | What’s missing from my instrumentation? | Code review against observability best practices checklists, if it happens at all |
The key takeaway isn’t any single query, it’s the compounding speed of asking follow-up questions in context. Each answer informs the next question, and the AI agent retains the full investigation thread. What traditionally requires 30+ minutes of console-hopping and mental context reconstruction collapses into a 5-minute conversational flow.
Beyond latency investigations
The walkthrough covered one scenario, but the same power supports a broad range of operational workflows:
- Security investigation: “Were there any unauthorized API calls to my production resources in the last 24 hours?”
- SLO compliance: “Which services are at risk of breaching their monthly error budget?”
- Performance optimization: “Show me the slowest operations across all my services and identify common patterns”
- Proactive gap analysis: “Review my service’s codebase and recommend observability improvements before we go to production”
Get Started
- Install the power: One click in Kiro IDE or browse the Kiro powers marketplace.
- Explore the source: Review the MCP server implementations on GitHub.
- Go deeper: Walk through the One Observability Workshop for comprehensive instrumentation patterns.
- Learn more about MCP on AWS: Read Harness the power of MCP servers with Amazon Bedrock Agents and Unlocking the power of Model Context Protocol (MCP) on AWS.
The next time you get paged at 2 AM, your first action won’t be opening a browser; it’ll be asking a question.